Wednesday, June 8, 2011
graphs for "relationship between DV and IV"
I was under the impression that you only have to look at one graph (the same scatterplot that you check homoscedasticity and Independence of Error Assumptions) in order to check for the assumption of the correct relationship between the DV and each IV. However, as I look at the power points from class, it says that we ares uppposed to plot the residuals on tY axis and the predicted values on the X axis, and that we are also supposed to plot the residuals on the y axis and EACH IV on the X axis. Does this mean that we need to show ALL of the graphs in our final project assignment?

Final Project - Results
Hi Guys,
Are we supposed to write up our transformed results for the results section, or our original data? I'm not sure.... thanks!
Tuesday, June 7, 2011
Assumptions (cont.)
Normality of Residuals: you can check this by clicking the "Plots" button in your regression window and checking the two boxes (Histogram and Normal Probability Plot) in "Standardized Residual Plots."
Independence of Residuals (cont.): the same residual vs. predicted plot that you used for "homoscedasticity" and "correct relationship between DV and IV" can be a rough way of testing this. But another (I think better) way would be to make a boxplot similar to Figure 4.4.6 (C) on p. 135 of the text.
To do that:
1) create a residual variable.
a) in your linear regression window, click "Save"
b) check the box for "Standardized" under "Residuals."
c) run the analysis
2) go to Graph --> Chart Builder --> Boxplot --> Clustered Boxplot.
Now you can put the "Standardized Residual" on the Y axis, a categorical variable in the X axis clustered by another categorical variable. The medians should be similar if there is independence of residuals.
Technically, you could also transform height into a categorical variable to cluster around, but you guys are probably getting exhausted already. So don't worry about it.
You wouldn't have to worry about serial dependency because this is cross-sectional data.
Please ask if you have more questions.
Good luck!
Monday, June 6, 2011
Assumptions
Hey guys,
Here are some responses to questions we've received about the assumptions you should be testing for:
- All relevant IVs are included in the model: this is based on theory, so you will not have a statistical output to "prove" that this assumption has not been violated. However, you should be able to explain that the relevant IVs (that pertain to your hypothesis and what you are testing/researching) are included and measured well.
- No measurement errors in the IV's: Again, this is done prior to the data collection. You want to make sure that the measures used to assess the IVs are reliable and valid.
- NOTE: Dr. Kim has not asked you to write up anything about the two assumptions above on your final project. However, they are important to consider in all future research.
- The relationships between IVs and DV are correctly specified: See the comments provided by David on Diana's questions about the final project (Thurs, June 2). You will be able to see a clear violation if one exists for this project.
- Independence of errors: check this with the residual and predicted plot….and Dr. Kim said “Basically, you don't want to see any specific pattern among the residuals that should be randomly distributed around the zero line.”
- Homoscedasticity: Create a scatterplot with the ZPRED and ZRESID and see if there is a pattern of systematic error. See the notes and powerpoints.
Sunday, June 5, 2011
Friday, June 3, 2011
Question on order of IVs
In this final project we are unsure of what doctor kim is looking for with which variable to be entered first. Smoking is the IV we are looking at so it should be entered first, but it also states that the other variables (gender, height etc.) are accounted for. Does this mean that we should enter the variables accounted for first or the most important (smoking). Also, I am enetering the height and age in the same block. Is this what is supposed to happen?
Thursday, June 2, 2011
Final Project
Do we need to attach the SPSS output for the final project?
Also, what graph do we look at for assumption 3 (relationship between IVs and DV)?
Also, what graph do we look at for assumption 3 (relationship between IVs and DV)?
Monday, May 23, 2011
Question on Article Review
Hi. On one of my article reviews a TA made a comment that in 5th the "th" should not be in superscript... is it just normal then as shown here, or is "th" not supposed to be included at all?
Thank you for your help!
Brooke
Monday, May 16, 2011
Sunday, May 8, 2011
Article Reviews
Hi Guys,
Are we allowed to do one theoretical article review like we were in ANOVA?
Thanks,
Brooke
Tuesday, May 3, 2011
EXAM 2 REVIEW SESSION
David will be holding a review session for Exam 2 today, Tuesday, May 3 from 3-4 PM. It will be in Room 314 of the SOP building.
Sunday, May 1, 2011
HW 2
For homework #2, question 4, can we simply paste the table that the info is in, or would you like us to extract it from the table and report it separately?
Thank you!
Brooke
Sunday, April 17, 2011
Questions on HW1
Hi! I have two questions:
1.) For the scatterplots, would you like us to distinguish the groups and have the lowess and least squares lines fit the groups or the overall?
2.) Is there a way to compute covariance and correlation on SPSS or are we supposed to do it by hand?
Thanks!
Brooke
Saturday, April 16, 2011
Homework #1
I hope you are having a good weekend! A few of us were talking and we are a little confused about when Homework #1 is due. Did we decided to keep it due on Monday? Or did it change to Wednesday?
Wednesday, April 6, 2011
Exam Review Session
Hey guys!
We will be holding a review session for Exam #1. It will be on Tuesday, April 12 from 10-11 AM in Room 311.
See you there!
Thursday, December 10, 2009
Table Note: Double or single spacing
I agree with Jay. In the APA manual (p. 141), "tables may be submitted either single- or double-spaced." I am not able to find about a specific requirement on table note, though.
I recommended double-spacing. However, single-space won't get a penalty.
I recommended double-spacing. However, single-space won't get a penalty.
Wednesday, December 9, 2009
double spacing note
in the APA manual, it says that the note under the tables SHOULD NOT be double spaced-ie, the note should be single spaced. However, many agree that Dr. Kim said that the everything should be double-spaced and we were not marked off for it on our homeworks.
Should we double space the note or single space the note?
Rebecca Kulzer
Should we double space the note or single space the note?
Rebecca Kulzer
Homoscedasticity and the Good Enough Rule
Hello - last minute question!
Regarding assumption 5 and homoscedasticity, I think I understand that the rule of thumb is that the assumption is violated when the highest variance is 10 times bigger than the lowest variance, ie. with a ratio of 10:1. However, on the "Assumptions in Regression" handout, the Heteroscedasticity Example does not have a variance 10 times bigger than the lowest varience, but there is heteroscedasticity and assumption 5 is violated. Could you clarify? Thank you!
Regarding assumption 5 and homoscedasticity, I think I understand that the rule of thumb is that the assumption is violated when the highest variance is 10 times bigger than the lowest variance, ie. with a ratio of 10:1. However, on the "Assumptions in Regression" handout, the Heteroscedasticity Example does not have a variance 10 times bigger than the lowest varience, but there is heteroscedasticity and assumption 5 is violated. Could you clarify? Thank you!
Tuesday, December 8, 2009
Question on titles...
On homework 3, I missed a point b/c I left out the various specific variables in the title as they were included in the table...however, I've been told that it is redundant to say something like "Speed Predicted by Anxiety, Time Constraint, etc" in our time IF anxiety, time constraint, etc. are the variables listed in the table on the left most column...could someone please clarify so I know which to do?
Thanks!!
Thanks!!
Monday, December 7, 2009
Another question
On our table #2, if we included a sentence or two in our write-up about the transformation, can we also put something like Height = centered height...etc. in our note for the table...or do we not need to???
Also, in my table I've listed Height^2 as one of the variables...is this ok or should I say "height squared"?
Also, in my table I've listed Height^2 as one of the variables...is this ok or should I say "height squared"?
another question
on our second table, do we need significance (aka ***) for each value-B, SEB and beta-or just for the beta???
Answers to your questions
One of the TAs summarized and forwarded your questions to me. TAs, thank you so much! These are my answers.
1. When reporting desriptive statistics like beta, standard error, etc... in our APA table when the number is 0.001 (for example) would we insert 0.00 or would we include 0.001?
0.00 not 0.001
2. Also, although it doesn't need to be APA, for multicollinearity statistics do you want us to give the specific numbers or just whether the numbers meet the cutoffs?
Copy and paste the table that lists muliticollinearity statistics and state whether they meet the cutoffs.
3. Could someone provide an example of a title for question 1...how do we state correlations between, SD and M without being redundant of info provided in the table?
descriptive statistics (or means, standard deviations) and correlations of study variables (please do not copy and paste this. you need to format it according to the APA styles.)
4. For question 3, do we need to state why we "decided" to use the square method to transform...we were not taught how to decide which to do. Can we just say something to the effect of "the plots show we need to transform____?
Yes. Please read the question carefully. The answer is there. (hint: scatterplot)
5.Do we need to report the exact values for VIF and tolerance when we talk/write about multicollinearity?
Please refer to my answer to Question 3 above.
6. In our write-up for number 6, how do we report transformation? Could we please have an example of that...also, do we need to report anything about cheight, sqheight, or sqCheight anywhere in that write up?
"In the analysis the height variable was centered. Also, a quadratic term of height was created by squaring the centered height variable, which, then, was entered into the regression model."
7.Do we need to paste the bivariate partial plots for number 8? aka the cheight or the sqcheight?
I haven't asked for any partial plots for number 8. Please read on the blog my answers about the assumption checking for Questions 2, 5 and 8.
8.So my understanding is that we only round to 2 decimal places on tables. What do we do with a number like 0.00049? SPSS by default shows 3 decimal places. So that would be shown as 0.005. Rounding to 2 places would make that 0.01. However, looking at the original number, we would get 0.00. These seem like quite different numbers. Do we put a note somewhere in the table?
Please refer to my answer to the number 1 above. Also, look at pp. 113-114 APA manual.
1. When reporting desriptive statistics like beta, standard error, etc... in our APA table when the number is 0.001 (for example) would we insert 0.00 or would we include 0.001?
0.00 not 0.001
2. Also, although it doesn't need to be APA, for multicollinearity statistics do you want us to give the specific numbers or just whether the numbers meet the cutoffs?
Copy and paste the table that lists muliticollinearity statistics and state whether they meet the cutoffs.
3. Could someone provide an example of a title for question 1...how do we state correlations between, SD and M without being redundant of info provided in the table?
descriptive statistics (or means, standard deviations) and correlations of study variables (please do not copy and paste this. you need to format it according to the APA styles.)
4. For question 3, do we need to state why we "decided" to use the square method to transform...we were not taught how to decide which to do. Can we just say something to the effect of "the plots show we need to transform____?
Yes. Please read the question carefully. The answer is there. (hint: scatterplot)
5.Do we need to report the exact values for VIF and tolerance when we talk/write about multicollinearity?
Please refer to my answer to Question 3 above.
6. In our write-up for number 6, how do we report transformation? Could we please have an example of that...also, do we need to report anything about cheight, sqheight, or sqCheight anywhere in that write up?
"In the analysis the height variable was centered. Also, a quadratic term of height was created by squaring the centered height variable, which, then, was entered into the regression model."
7.Do we need to paste the bivariate partial plots for number 8? aka the cheight or the sqcheight?
I haven't asked for any partial plots for number 8. Please read on the blog my answers about the assumption checking for Questions 2, 5 and 8.
8.So my understanding is that we only round to 2 decimal places on tables. What do we do with a number like 0.00049? SPSS by default shows 3 decimal places. So that would be shown as 0.005. Rounding to 2 places would make that 0.01. However, looking at the original number, we would get 0.00. These seem like quite different numbers. Do we put a note somewhere in the table?
Please refer to my answer to the number 1 above. Also, look at pp. 113-114 APA manual.
Attach "all printouts"
Because the total SPSS output could be very long, you don't need to attach everything. However, you need to copy and paste things as follows:
Questions 2, 5 and 8: relevant plots (assumptions)
Question 3: scatterplots
Qustions 4, 5 and 8: table that shows multicollinearity
Questions 2, 5 and 8: relevant plots (assumptions)
Question 3: scatterplots
Qustions 4, 5 and 8: table that shows multicollinearity
Saturday, December 5, 2009
More questions
1. do we need to report R in our write up for number 6? Or just R2 or delta R2?
2. How do we get SPSS to show us the exact result for p...sig?
If we find SEB, etc. values that are .000 or .0002, how do we report them in the table??
3. the * for p values...does it matter if we just hit shift and ** or do we need to make them a superscript...does it matter???
4.I'm lost on what to report in my note for the table for question 7. Do we need to say that height means centered height? Do we need to report the delta R2 if we didn't report them in the table but reported them in our write-up? I was told this was redundancy on my homework #3?
2. How do we get SPSS to show us the exact result for p...sig?
If we find SEB, etc. values that are .000 or .0002, how do we report them in the table??
3. the * for p values...does it matter if we just hit shift and ** or do we need to make them a superscript...does it matter???
4.I'm lost on what to report in my note for the table for question 7. Do we need to say that height means centered height? Do we need to report the delta R2 if we didn't report them in the table but reported them in our write-up? I was told this was redundancy on my homework #3?
rounding on tables
So my understanding is that we only round to 2 decimal places on tables. What do we do with a number like 0.00049?
SPSS by default shows 3 decimal places. So that would be shown as 0.005. Rounding to 2 places would make that 0.01. However, looking at the original number, we would get 0.00.
These seem like quite different numbers. Do we put a note somewhere in the table?
outliers
according to our notes, the cut off is determined by 2k/n for large sample sizes... what is k?
Question about final project
1. Could someone provide an example of a title for question 1...how do we state correlations between, SD and M without being redundant of info provided in the table?
2.For question 3, do we need to state why we "decided" to use the square method to transform...we were not taught how to decide which to do. Can we just say something to the effect of "the plots show we need to transform____?
3.Do we need to report the exact values for VIF and tolerance when we talk/write about multicollinearity?
4. In our write-up for number 6, how do we report transformation? Could we please have an example of that...also, do we need to report anything about cheight, sqheight, or sqCheight anywhere in that write up?
5.Do we need to paste the bivariate partial plots for number 8? aka the cheight or the sqcheight?
2.For question 3, do we need to state why we "decided" to use the square method to transform...we were not taught how to decide which to do. Can we just say something to the effect of "the plots show we need to transform____?
3.Do we need to report the exact values for VIF and tolerance when we talk/write about multicollinearity?
4. In our write-up for number 6, how do we report transformation? Could we please have an example of that...also, do we need to report anything about cheight, sqheight, or sqCheight anywhere in that write up?
5.Do we need to paste the bivariate partial plots for number 8? aka the cheight or the sqcheight?
Friday, December 4, 2009
No Reviews During Finals Week
Hey All!
I just wanted to let you know that there will not be any review sessions during finals week. However, if you have questions feel free to ask here on the blog or email and we will respond on the blog!
--Your TAs
I just wanted to let you know that there will not be any review sessions during finals week. However, if you have questions feel free to ask here on the blog or email and we will respond on the blog!
--Your TAs
Reporting Descriptive Statistics
When reporting desriptive statistics like beta, standard error, etc... in our APA table when the number is 0.001 (for example) would we insert 0.00 or would we include 0.001?
Also, although it doesn't need to be APA, for multicollinearity statistics do you want us to give the specific numbers or just whether the numbers meet the cutoffs?
When significance is .001 and we do not know what the numbers mean when we click on them, what should we report p < .001 or p < .01?
Thank you so much!
Also, although it doesn't need to be APA, for multicollinearity statistics do you want us to give the specific numbers or just whether the numbers meet the cutoffs?
When significance is .001 and we do not know what the numbers mean when we click on them, what should we report p < .001 or p < .01?
Thank you so much!
normality of error plot not required for Question 5
One of the Mon-Wed students told me that in that class I told the students that only two plots for homoscedasticity and correct form of relationship between DV-IVs are required for Question 5. So, I am not going to require a normality of error plot for Question 5. I recommend including a normality of error plot for Question 5, but if you don't, you won't be penalized for that. No worries!
If you have any other questions, please let me know.
If you have any other questions, please let me know.
Testing Assumption 3 (Correct form of relationship between DV-IVs
Analyze-Regression-Linear, then specify your model. Then, click on the Plots button. Next, move Dependent into Y and zpred into X. In that way, you can test the correct form relationship. You need this plot for Questions 2, 5 and 8.
APA styles graded
You need to provide APA-formatted tables for Questions 1 and 7 and an APA-formatted write-up for for Question 6. For these qustions, APA formats will be graded. For the other questions, you don't need to follow APA styles.
my office hours
Hi Class,
I know you have some questions regarding the final project. Please let me know those questions. I will do my best to answer those questions. However, if you think you need my help, please visit me during my office hours. I am going to provide extended office hours next week.
9 am - 11 am, Monday Dec. 4, 2009
9 am - 11 am, Tuesday Dec. 5, 2009
9 am - 11 am, Wednesday Dec. 6, 2009
You can stop by my office during those hours, bu I strongly recommend to schedule a session with me by e-mail before your visiting.
Sung
I know you have some questions regarding the final project. Please let me know those questions. I will do my best to answer those questions. However, if you think you need my help, please visit me during my office hours. I am going to provide extended office hours next week.
9 am - 11 am, Monday Dec. 4, 2009
9 am - 11 am, Tuesday Dec. 5, 2009
9 am - 11 am, Wednesday Dec. 6, 2009
You can stop by my office during those hours, bu I strongly recommend to schedule a session with me by e-mail before your visiting.
Sung
testing assumptions
For assumption checking (Question 8), I want you to test homoscedasticity, the DV-IV relationship and normality of errors using relevant plots. "Furthermore," evaluate multicollinearity for these questions. For Questions 2 and 5, test only homoscedasticity and the DV-IV relationship.
Thursday, December 3, 2009
Final Project Question
sorry to have so many questions... I just wanted to confirm something... in class he told us that we only need to use APA format for the tables and for the write-up in number 6. -- are we going to have to use APA format for any of our other answers, even if we are talking about measures of, for example, multicollinearity? I want to make sure that I don't lose points over something I can prevent...
Wednesday, December 2, 2009
APA Style Resources
Hi everyone,
I showed a website on APA style at review session today and promised that I will blog it... here it is....
http://www.docstyles.com/apacrib.htm
Also, you can check the Purdue Owl website too! http://owl.english.purdue.edu/owl/resource/560/01/
This websites have been updated after the 6th ed. APA publication came out. Hope these will be helpful resources for you. :)
I showed a website on APA style at review session today and promised that I will blog it... here it is....
http://www.docstyles.com/apacrib.htm
Also, you can check the Purdue Owl website too! http://owl.english.purdue.edu/owl/resource/560/01/
This websites have been updated after the 6th ed. APA publication came out. Hope these will be helpful resources for you. :)
Plots to test assumptions
I'm a little confused on the which assumptions are being tested & with what plots? Can you correct me/give me more info on the following:
Assumptions 1 & 2 we don't look at any plots for
Assumption 3: we look at a partial regression plot...is it the same one as for homoscedasicity??
Assumption 4:I have no idea!
Assumption 5: Homoscedasicity...a residual plot...is this the same as a partial regression plot?
Assumption 6: Histogram and Normal p-p plot?
Also, what is a bivariate scatterplot & is this different from a partial regression plot? do we ever use a bivariate scatterplot?
Assumptions 1 & 2 we don't look at any plots for
Assumption 3: we look at a partial regression plot...is it the same one as for homoscedasicity??
Assumption 4:I have no idea!
Assumption 5: Homoscedasicity...a residual plot...is this the same as a partial regression plot?
Assumption 6: Histogram and Normal p-p plot?
Also, what is a bivariate scatterplot & is this different from a partial regression plot? do we ever use a bivariate scatterplot?
Question about Cook's D chart on project
The Cook's D on question 4 (with transformed variable) look almost identical or perhaps is identical to the one in question 8 (centered and transformed variable).
Is this suppose to happen?
Is this suppose to happen?
Tuesday, December 1, 2009
Regression with a Categorical Independent Variable (UPDATED!!!)
Hi everyone,
Since I noticed that some of you will have a quiz tomorrow without getting your HW4 back, I would like to provide some feedback which may help your quiz tomorrow.
If you can still remember that you were asked to calculate group mean for different levels (age group) of an independent variable, some of you might have rounded off the unstandardized betas before plugging them into the formula that help you figure out the group mean. I suggest you not to round off unstandardized betas before you plug them into the formula in order to get a more accurate group means. For example, you can see that you got an unstandardized beta (4.5678) on the coefficient table (spss output), plug in 4.5678 instead of 4.57 into the equation to get a more accurate group mean.
Hope this helps!
All the best with the quiz tomorrow or Thursday!! :)
UPDATE-->
I would like to add something too.
For the HW4 question 3 asking you about whether both first session and number of session significantly predict DV or not. You need to look at the significance level in the coefficient table (spss output), but not assessing the significance level by looking at R square only. The significance level is determined by whether the beta of the IV reaches statistical significance or not.
I know this is late at night... I wish I could have put this up earlier.
I'm praying for you guys...
Since I noticed that some of you will have a quiz tomorrow without getting your HW4 back, I would like to provide some feedback which may help your quiz tomorrow.
If you can still remember that you were asked to calculate group mean for different levels (age group) of an independent variable, some of you might have rounded off the unstandardized betas before plugging them into the formula that help you figure out the group mean. I suggest you not to round off unstandardized betas before you plug them into the formula in order to get a more accurate group means. For example, you can see that you got an unstandardized beta (4.5678) on the coefficient table (spss output), plug in 4.5678 instead of 4.57 into the equation to get a more accurate group mean.
Hope this helps!
All the best with the quiz tomorrow or Thursday!! :)
UPDATE-->
I would like to add something too.
For the HW4 question 3 asking you about whether both first session and number of session significantly predict DV or not. You need to look at the significance level in the coefficient table (spss output), but not assessing the significance level by looking at R square only. The significance level is determined by whether the beta of the IV reaches statistical significance or not.
I know this is late at night... I wish I could have put this up earlier.
I'm praying for you guys...
APA stuff
If the Journal title has an ampersand (&) used instead of "and", should I type out "and" in my reference or should I keep the & symbol?
Also, is PTSD known widely enough that I can leave it at that or should I spell it out?? It's part of the title of the journal article.
Also, is PTSD known widely enough that I can leave it at that or should I spell it out?? It's part of the title of the journal article.
Monday, November 23, 2009
Homoscedasticity (con't)
This is the supplementary comment on homoscedasticity, see the original post below... (just 2 posts down).
Homoscedasticity is tested by a scatter plot of residuals. Residuals are errors, ie. actual score in population - predicted score. The line in the middle of the scatter plot is the mean of Y, ie. the mean of predicted scores.
If you get a rectangular shape of residuals around the line, that means that the residuals are evenly distributed around the mean. This is a good thing. Because homoscedasticity means equal variance of residuals, ie. the variance between the mean of y (the line, or y=0, which means no error) and the errors is homogeneous. So, getting a rectangular shape, which your graph may look like this...
 (note: dots are residuals)
You can see that the residuals that is furthest away from the line above and below, from left to right have almost equal distance from the line. This is homoscedasticity.
In contrast, if you get a pattern, such as a "blow horn", which look like this...

You can see how the residuals actually fan out. That is a bad sign! The residuals that are the variance on the left hand side of the graph is small while the variance on the right hand side is huge. The variance of the residuals across the graphs are not homogeneous! So, the blow horn shape definitely violates the assumption of homoscedasticity, because this is heteoskedasticity.
Also, just a reminder, there is rule of tumb for you the check this assumption as well. The assumption is violated when the highest variance is 10 times bigger than the lowest variance, ie. with a ratio of 10:1.
Hope this helps.
Homoscedasticity is tested by a scatter plot of residuals. Residuals are errors, ie. actual score in population - predicted score. The line in the middle of the scatter plot is the mean of Y, ie. the mean of predicted scores.
If you get a rectangular shape of residuals around the line, that means that the residuals are evenly distributed around the mean. This is a good thing. Because homoscedasticity means equal variance of residuals, ie. the variance between the mean of y (the line, or y=0, which means no error) and the errors is homogeneous. So, getting a rectangular shape, which your graph may look like this...
 (note: dots are residuals)
You can see that the residuals that is furthest away from the line above and below, from left to right have almost equal distance from the line. This is homoscedasticity.
In contrast, if you get a pattern, such as a "blow horn", which look like this...

You can see how the residuals actually fan out. That is a bad sign! The residuals that are the variance on the left hand side of the graph is small while the variance on the right hand side is huge. The variance of the residuals across the graphs are not homogeneous! So, the blow horn shape definitely violates the assumption of homoscedasticity, because this is heteoskedasticity.
Also, just a reminder, there is rule of tumb for you the check this assumption as well. The assumption is violated when the highest variance is 10 times bigger than the lowest variance, ie. with a ratio of 10:1.
Hope this helps.
Creating dummy variables in SPSS
Here is the command for creating dummy variables in SPSS. (from Dr. Mari Clements' notes)
transform-->
Recode into different variables-->
click over the categorical variable you need to recode-->
create a new name for the recoded variable-->
click change-->
click old and new variables-->
type in the old value (eg. 2)-->
type in the new value (eg. 1)-->
click add-->
repeat as necessary to get all values-->
continue-->
OK
transform-->
Recode into different variables-->
click over the categorical variable you need to recode-->
create a new name for the recoded variable-->
click change-->
click old and new variables-->
type in the old value (eg. 2)-->
type in the new value (eg. 1)-->
click add-->
repeat as necessary to get all values-->
continue-->
OK
Homoscedasicity
I have a question on interpreting whether our residual plot meets this assumption. In class, we were told if there was a pattern, the homosce. assumption has been violated. However, from other readings, it seems that if the points create a rectangular "scatter", it has met this assumption. I'm confused. Could you please give some further details about how to interpret this plot appropriately!
Thanks!
Thanks!
APA Publication manual (first printing)
Hello regression friends... (sorry for the nerdy greetings)
I would like to let you know that APA is now offering free replacement of the 6th ed. APA publication manual (first printing, which has tons of errors) with its second printing. This offer will end on December 15. So, basically, what you need to do is to call up APA and tell them that you will be sending them your first printing manual, and they will send you back the second printing. For details, please go to the APA publication manual first priting FAQ. (Just in case the hyperlink is not working, here's the url: http://www.apastyle.org/manual/corrections-faqs.aspx) They have to receive your first printing manual by 12/15/09. So, act fast!
Also, I just checked the bookstore today, fyi: they are selling the first printing. The second printing got out in August, so, I guess you may be able to get them somewhere around.
Here's the section from the APA website regarding to the replacement:
I would like to let you know that APA is now offering free replacement of the 6th ed. APA publication manual (first printing, which has tons of errors) with its second printing. This offer will end on December 15. So, basically, what you need to do is to call up APA and tell them that you will be sending them your first printing manual, and they will send you back the second printing. For details, please go to the APA publication manual first priting FAQ. (Just in case the hyperlink is not working, here's the url: http://www.apastyle.org/manual/corrections-faqs.aspx) They have to receive your first printing manual by 12/15/09. So, act fast!
Also, I just checked the bookstore today, fyi: they are selling the first printing. The second printing got out in August, so, I guess you may be able to get them somewhere around.
Here's the section from the APA website regarding to the replacement:
I purchased a copy of the first printing of the sixth edition of the Publication Manual from a source other than APA, but I still want a replacement. What do I need to do?
Even though you purchased your first printing of the sixth edition of the Publication Manual from another source, you are still welcome to participate in the return/exchange program. In order to receive an exchange replacement manual, you must return your current copy of the sixth edition to APA no later than December 15, 2009.
We would like to make this transaction as cost neutral to you as possible. A process has been created to provide you with a UPS postage paid return label that you can use to return the book to us. Please call the APA Service Center at 800-374-2721 for more information about the paid return postage process.
If you are interested in an exchange replacement copy, please contact the APA Service Center at your convenience for further information. Service Center staff can be reached at 800-374-2721 from 9:00 am until 6:00 pm (Eastern Time) Monday–Friday. E-mail correspondence can be directed to the Order Department.
Sunday, November 22, 2009
How to make a new post on this blog?
1. You have to become a "contributor" of this blog if you want to make a post here. So, respond to the invitation that Dr. Kim sent you earlier this quarter to become a contributor.
2. Once you accept the invitation and become a contributor, log in on this blog with your user name.
3. Once you logged in, you will find a button says "new post" right next to your email on the top right hand corner of the blog.
2. Once you accept the invitation and become a contributor, log in on this blog with your user name.
3. Once you logged in, you will find a button says "new post" right next to your email on the top right hand corner of the blog.
Dummy Variables
Someone posted/asked:
1. I'm confused about what I'm supposed to be doing with the Dummy Variables. I followed the slides and I got to the point where I'm recoding agegroup into a different variable. But it seems like I'm supposed to be separating the one group, agegroup, into 4 different age groups. So I started transforming 3 into 0, reference group, and so on but that isn't right.
2. Where do I put the c1, c2, c3?
Response:
You're right on transforming! So, you need to recode each age group in order to run the analyzes. It seems like you are lost in the transformation... Let's illustrate the transformation with an example.
Let's say you're running an analysis on how the size of animals (large, medium, and small) predicts their daily diet intake.
So, in your original data set, you have size of animal coded as 1 = small, 2= medium, 3 = large.
Since you can only compare 0 and 1 in categorical regression, unlike gender (male, female), you need to more than one contrast coded predictors. Lecture 12 slide 19 addresses the issue of having multiple levels in one independent variable (IV).
# contrast coding variable = # of levels of the categorical variable examined - 1
In this case, there are 3 levels for size of animal (IV), so, you need 3-1 = 2 contrast coded predictors (aka. independent variables), and I will name the 2 contrast coded predictors as "C1" and "C2".
Let's say I'm going to have "small-sized animal" as the reference group, ie. small = 0, for both C1 and C2.
Then in C1, I will have medium animals as 1, anything not "medium" will be 0.
In C2, I will have large animals as 1, anything not large will be 0.
I will do the following...
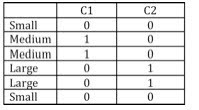
So, C1, C2, and C3 are the names for the new predictor variables that will appear on SPSS. You will create C1, C2, and C3 as new variables in SPSS when you're transforming/recoding. Hope this helps.
1. I'm confused about what I'm supposed to be doing with the Dummy Variables. I followed the slides and I got to the point where I'm recoding agegroup into a different variable. But it seems like I'm supposed to be separating the one group, agegroup, into 4 different age groups. So I started transforming 3 into 0, reference group, and so on but that isn't right.
2. Where do I put the c1, c2, c3?
Response:
You're right on transforming! So, you need to recode each age group in order to run the analyzes. It seems like you are lost in the transformation... Let's illustrate the transformation with an example.
Let's say you're running an analysis on how the size of animals (large, medium, and small) predicts their daily diet intake.
So, in your original data set, you have size of animal coded as 1 = small, 2= medium, 3 = large.
Since you can only compare 0 and 1 in categorical regression, unlike gender (male, female), you need to more than one contrast coded predictors. Lecture 12 slide 19 addresses the issue of having multiple levels in one independent variable (IV).
# contrast coding variable = # of levels of the categorical variable examined - 1
In this case, there are 3 levels for size of animal (IV), so, you need 3-1 = 2 contrast coded predictors (aka. independent variables), and I will name the 2 contrast coded predictors as "C1" and "C2".
Let's say I'm going to have "small-sized animal" as the reference group, ie. small = 0, for both C1 and C2.
Then in C1, I will have medium animals as 1, anything not "medium" will be 0.
In C2, I will have large animals as 1, anything not large will be 0.
I will do the following...

So, C1, C2, and C3 are the names for the new predictor variables that will appear on SPSS. You will create C1, C2, and C3 as new variables in SPSS when you're transforming/recoding. Hope this helps.
Thursday, November 19, 2009
Common Mistakes on Article Reviews!!!
So now that you have turned in 4 article reviews and received grades back, we wanted to note some common mistakes that were made that you should be careful for in the next 3 article reviews.
1. Unless they are general acronyms that anyone would know that looks at it, you need to write out acronyms. Only list acronyms when you need to use them again in your article review (AR). Also, make sure you type out the entire term when the acronym first appears in your AR, just like shown here.
2. Make sure you inclue doi or a website that anyone (without passwords) can access. The doi can also be found on the article page after you click on the title from EBSCO. For any articles that do not have a doi (which should be RARE), do a public search on google or google scholar. See APA manual for further details on finding doi.
3. While on the subject of doi's...Look up the proper way to reference the doi! There should be no space between the colon and the first number or letter of the identifier. Also, "doi" should not be capitalized. This is clear in the 6th edition references.
4. In general, pay attention to how to reference proper APA style. You are in a psychology graduate program, so you will need to know how to use APA properly for most (if not all) the papers you write here! It will and should become second nature but until then, triple check that all aspects are correct!
a.) Make sure to FULLY reference every piece...That means the correct initials for the names (if it gives a middle name or initial, it should be referenced with that middle initial)...that means the full title...that means the full and proper journal name...etcetera
b.) Make sure to space the initials properly, there is one space between initials!
c.) The order of the names in the article (believe it or not) IS IMPORTANT. Make sure to keep the correct order of the author names
d.) Make sure to watch the rules for article title and source title capitalization and italicizing. For a journal article, the first word of the article title is the only thing capitalized unless there is a colon, in which the first word after the colon is capitalized as well. The only other exception to this is you would also capitalize a word if it were a proper noun...think of this also like if you would capitalize a word mid-sentence, then you would also capitalize that word in the article title.
For the journal name, all words are capitalized and in italics
e.) the journal volume number is also in italics
f.) you include the issue number (the number in parentheses, which is NOT italicized) ONLY IF the journal paginates by issue. This means that you should do a search for the journal name, if you see that each issue it goes back to page 1, you WOULD include the issue number. An easy way to see this is if you see your page numbers go up above 200-250, it most likely does not paginate by issue and you would NOT include the issue number. However, if your article's pages are lower (1-200) either way you should check to see if the journal paginates by issue!
g.) already mentioned, but worth mentioning again! doi is NOT capitalized in the reference...also, there is NO SPACE between the colon and the identifier.
5. It's worth saying it short and sweet again: REFERENCE CAREFULLY AND FULLY!
6. Express numbers in numerical form when numbers are greater than 10 (e.g., 100, or 11). Express number in words when numbers less than 10 (e.g., nine, or two). Always express numbers in words when it is the first word in the sentence (e.g., One-hundred percent of the class is amazing).
7. APA recommends using 12-point Times New Roman font
8. APA clearly states that all words in a heading 4 or more words should be capitalized (e.g., Population From Which Participants Were Drawn)
9. For population we clearly stated earlier (and it is clear in the example) that you need to include the following information: age, number in study, gender, and ethnicity. This is for both quantitative AND qualitative studies. If some or all the information is not clear or not given, state so IN THE POPULATION SECTION.
10. These are meant to be one full page single spaced. Try to keep it as close to one page as possible, if you go 1/4 page over or under, we may have to take points off.
11. This is an APA style assignment (as is this class...again...until it becomes second nature you need to make sure to do it carefully), therefore, throughout the entire paper you must keep with APA guidelines. This is a lesson in summarizing so you don't have to re-read an entire article, so really quotation should be left out. However, if you DO quote (which, again is better not to) it is important (IMPORTANT) that if you use quotations that you cite properly. Look this up again...but for a random example (Labriola, et al., 2009, p. 234).
12. The relevance section is really for how this article is relevant for YOUR research interests. This section is where you would explain why and how it relates to your interests, not how it is relevant for the population. Also...I hope you realize that it is a waste of your time to read something and then do this AR if you aren't going to use it in the future!
For now, this is all. I know that it is a lot...but most of it has to do with APA style. This is not the only class that it is necessary to have APA style (especially referencing and in-text citing) correct! It will benefit you to learn it and practice it for all of your papers!
Questions? Further Comments?
--Your TAs
1. Unless they are general acronyms that anyone would know that looks at it, you need to write out acronyms. Only list acronyms when you need to use them again in your article review (AR). Also, make sure you type out the entire term when the acronym first appears in your AR, just like shown here.
2. Make sure you inclue doi or a website that anyone (without passwords) can access. The doi can also be found on the article page after you click on the title from EBSCO. For any articles that do not have a doi (which should be RARE), do a public search on google or google scholar. See APA manual for further details on finding doi.
3. While on the subject of doi's...Look up the proper way to reference the doi! There should be no space between the colon and the first number or letter of the identifier. Also, "doi" should not be capitalized. This is clear in the 6th edition references.
4. In general, pay attention to how to reference proper APA style. You are in a psychology graduate program, so you will need to know how to use APA properly for most (if not all) the papers you write here! It will and should become second nature but until then, triple check that all aspects are correct!
a.) Make sure to FULLY reference every piece...That means the correct initials for the names (if it gives a middle name or initial, it should be referenced with that middle initial)...that means the full title...that means the full and proper journal name...etcetera
b.) Make sure to space the initials properly, there is one space between initials!
c.) The order of the names in the article (believe it or not) IS IMPORTANT. Make sure to keep the correct order of the author names
d.) Make sure to watch the rules for article title and source title capitalization and italicizing. For a journal article, the first word of the article title is the only thing capitalized unless there is a colon, in which the first word after the colon is capitalized as well. The only other exception to this is you would also capitalize a word if it were a proper noun...think of this also like if you would capitalize a word mid-sentence, then you would also capitalize that word in the article title.
For the journal name, all words are capitalized and in italics
e.) the journal volume number is also in italics
f.) you include the issue number (the number in parentheses, which is NOT italicized) ONLY IF the journal paginates by issue. This means that you should do a search for the journal name, if you see that each issue it goes back to page 1, you WOULD include the issue number. An easy way to see this is if you see your page numbers go up above 200-250, it most likely does not paginate by issue and you would NOT include the issue number. However, if your article's pages are lower (1-200) either way you should check to see if the journal paginates by issue!
g.) already mentioned, but worth mentioning again! doi is NOT capitalized in the reference...also, there is NO SPACE between the colon and the identifier.
5. It's worth saying it short and sweet again: REFERENCE CAREFULLY AND FULLY!
6. Express numbers in numerical form when numbers are greater than 10 (e.g., 100, or 11). Express number in words when numbers less than 10 (e.g., nine, or two). Always express numbers in words when it is the first word in the sentence (e.g., One-hundred percent of the class is amazing).
7. APA recommends using 12-point Times New Roman font
8. APA clearly states that all words in a heading 4 or more words should be capitalized (e.g., Population From Which Participants Were Drawn)
9. For population we clearly stated earlier (and it is clear in the example) that you need to include the following information: age, number in study, gender, and ethnicity. This is for both quantitative AND qualitative studies. If some or all the information is not clear or not given, state so IN THE POPULATION SECTION.
10. These are meant to be one full page single spaced. Try to keep it as close to one page as possible, if you go 1/4 page over or under, we may have to take points off.
11. This is an APA style assignment (as is this class...again...until it becomes second nature you need to make sure to do it carefully), therefore, throughout the entire paper you must keep with APA guidelines. This is a lesson in summarizing so you don't have to re-read an entire article, so really quotation should be left out. However, if you DO quote (which, again is better not to) it is important (IMPORTANT) that if you use quotations that you cite properly. Look this up again...but for a random example (Labriola, et al., 2009, p. 234).
12. The relevance section is really for how this article is relevant for YOUR research interests. This section is where you would explain why and how it relates to your interests, not how it is relevant for the population. Also...I hope you realize that it is a waste of your time to read something and then do this AR if you aren't going to use it in the future!
For now, this is all. I know that it is a lot...but most of it has to do with APA style. This is not the only class that it is necessary to have APA style (especially referencing and in-text citing) correct! It will benefit you to learn it and practice it for all of your papers!
Questions? Further Comments?
--Your TAs
Article Reviews
Your article reviews are ready to be picked up at the front desk.
Also, I need to mention again our class has a late penalty. "If any of the assignments are turned late, ..." Please take a look at the fourth page of our syllabus for more.
Also, I need to mention again our class has a late penalty. "If any of the assignments are turned late, ..." Please take a look at the fourth page of our syllabus for more.
Wednesday, November 18, 2009
Clarification on variable selection + question (HW4)
1) For output on question 3, 4, 5, do we need to include age group into independent variable?
Although the instruction states that only first session outcome score and number of sessinos needs to be added, I was thinking perhaps the age group was left out.
2) If a variable is significant (p=.02) but the R2 of the scatterplot is almost close to zero (R2=.006), should the variable be left out of the model since the R2 is weak?
Although the instruction states that only first session outcome score and number of sessinos needs to be added, I was thinking perhaps the age group was left out.
2) If a variable is significant (p=.02) but the R2 of the scatterplot is almost close to zero (R2=.006), should the variable be left out of the model since the R2 is weak?
Monday, November 16, 2009
One more question
Sorry guys! I totally forgot about this question. In our APA manual, it states that it's okay not to list every individual variable in the table's title, as long as they are listed in the table. Is this how you interpret it??? Or should my title include all of the ind. variables we use in our steps??
Thanksgiving week
There will be no review session on the Wednesday of thanksgiving week. Happy thanksgiving!
Sunday, November 15, 2009
ΔR^2
If we have ΔR2 in our table, does the R2 value for Step 1 go in the table or the note? Could the R2 value technically be seen as a change from the null? Or is that an improper understanding of it?
Thanks!
Saturday, November 14, 2009
P values
Hi TAs,
In our p note (* p < .05. ** p < .01. *** p < .001), if we underline the "less than" signs to indicate "equal to or less than" and then place asterisks accordingly in our Table, will we get points taken off? (I would have underlined here, but don't know how to underline on this blog) - Thanks!
In our p note (* p < .05. ** p < .01. *** p < .001), if we underline the "less than" signs to indicate "equal to or less than" and then place asterisks accordingly in our Table, will we get points taken off? (I would have underlined here, but don't know how to underline on this blog) - Thanks!
Title for Table
Maybe somebody already asked this, but I scanned the blog and cannot find the question so forgive me if this is a repeat question...
If our title for our table goes beyond one line do we double space the extra lines or single space our title to make it look tighter?
Also, For the different steps, isn't the change in R squared the same for each variable of each step. In other words, wouldn't we have the same number for the variables that fall under each step? If so, should we go ahead and plug the same number in anyway-redundant as it may be?
THank you so much.
If our title for our table goes beyond one line do we double space the extra lines or single space our title to make it look tighter?
Also, For the different steps, isn't the change in R squared the same for each variable of each step. In other words, wouldn't we have the same number for the variables that fall under each step? If so, should we go ahead and plug the same number in anyway-redundant as it may be?
THank you so much.
Friday, November 13, 2009
More questions! Sorry!
1. If our R square change gives us a three digit number past the decimal point such as .004, if we rounded that we would be reported R2 = .00...that's not correct right? We would need to put all 3 decimal places in this instance?
2.If we end up only having either p < .001 and p < .05, do we just use two stars in our note or would we say *p < .05, ***p < .001???
sorry these are so technical, but we're losing points b/c of this stuff and the manual does not give specifics esp. on tables!
2.If we end up only having either p < .001 and p < .05, do we just use two stars in our note or would we say *p < .05, ***p < .001???
sorry these are so technical, but we're losing points b/c of this stuff and the manual does not give specifics esp. on tables!
Table spacing
On page 141 of the APA manual, it states that table may be submitted either single- or double-spaced...so, do we HAVE to double space it or does it just need to be readable?
Thursday, November 12, 2009
Reporting significance level
Someone from the class asked how to report p value if it is great than .05 or equal to .05.
According to the APA publication manual page 114, report the exact p value when it is not less than .001.
When the significance level is .05, you will report p = .05.
When the significance level is great than .05, eg. .07, you will report p = .07.
When you are indicating significance level of values in your table, you still use * p < .05, * p <.01, or *** p < .001. You are not going to label any values with an asterisk that has a significance level equal to or greater than .05. Statistics which have significance level that is equal to or greater than .05 is not considered as significant if the model is using an alpha = .05.
Hope this helps!
According to the APA publication manual page 114, report the exact p value when it is not less than .001.
When the significance level is .05, you will report p = .05.
When the significance level is great than .05, eg. .07, you will report p = .07.
When you are indicating significance level of values in your table, you still use * p < .05, * p <.01, or *** p < .001. You are not going to label any values with an asterisk that has a significance level equal to or greater than .05. Statistics which have significance level that is equal to or greater than .05 is not considered as significant if the model is using an alpha = .05.
Hope this helps!
Question regarding results paragraph
Do we need to indent the first line of our results write up? I got marked on my last homework for not doing so, but others that did not do it didn't. Also, none of the examples given by Dr. Kim have the first line indented.
sample write up for HW3
The prediction of college students’ global self worth from school competence, intellectual ability, social acceptance, physical attractiveness, athletic competence, and job competence was explored using a hierarchical multiple regression. The B, SEB, and β for each predictor at each step of the equation are presented in Table 1. The hypothesis that college students’ global self worth would be significantly predicted by school competence and intellectual ability was supported, R2 = .38, F(2, 368) = 113.07, p < .001. Both school competence and intellectual ability significantly predicted global self worth, with higher levels of school competence and intellectual ability associated with higher global self worth. The addition of social acceptance and physical attractiveness to the model significantly improved prediction of
HW 3
When we report R2 for each step, which table to we get the F statistic, the anova table or the model summary?
my understanding was that the anova table in third block explained the signifcance of the overall model, where as the model summary explains significance within each step. . . .correct?
In our example Dr. Kim gave in class, Confidence intervals are not reported. Do we need to report them in our homework
Christie
my understanding was that the anova table in third block explained the signifcance of the overall model, where as the model summary explains significance within each step. . . .correct?
In our example Dr. Kim gave in class, Confidence intervals are not reported. Do we need to report them in our homework
Christie
Question for HW3
Okay, so I have a few questions:
1. If the p value is larger than .05, in the writeup do we just put p > .05? Or do we just state that the model was not significant and not provide any data at all? Basically, what do we do when the model does not change R2 and the pvalue is way to large?
2. If the R2 change equals .002, how do we report that on our table? As .00 or 0 or do we not report it at all?
3. When we are reporting the results in the writeup, for the second and third step do we use change in R2 or just R2?
4. When we are summing up and saying "the overall model," do we look at the Anova table to write up our results (eg The overall model R2 was significantly different than zero, F (7, 887) = 134.56, p < .001) (I changed the numbers) and if so, where do we find F on the anova table
1. If the p value is larger than .05, in the writeup do we just put p > .05? Or do we just state that the model was not significant and not provide any data at all? Basically, what do we do when the model does not change R2 and the pvalue is way to large?
2. If the R2 change equals .002, how do we report that on our table? As .00 or 0 or do we not report it at all?
3. When we are reporting the results in the writeup, for the second and third step do we use change in R2 or just R2?
4. When we are summing up and saying "the overall model," do we look at the Anova table to write up our results (eg The overall model R2 was significantly different than zero, F (7, 887) = 134.56, p < .001) (I changed the numbers) and if so, where do we find F on the anova table
Hierarchical MR write-up question...
Hey!
I was wondering how to write up the results for the HMR. I was thinking that it would be written this way but please let me know if this is wrong:
I was wondering how to write up the results for the HMR. I was thinking that it would be written this way but please let me know if this is wrong:
- you start with R2 for step 1 and its significance
- then change in R2 for step 2 and its significance
- and then change in R2 for step 3 and its significance
- and, lastly, for the overall model it would be R2 for step 3 and its significance....???
Thanks!
Wednesday, November 11, 2009
For students who were at the Wednesday evening review session
Hi guys,
Thanks for coming to the review session tonight. I was just going through the notes and I realized that I made a mistake...
When we were talking about which F ratio and df you are reporting for each step of a hierarchical multiple regression, I told you to report the statistics from ANOVA table. Whoops, I was wrong. You should be reporting statistics under the "change statistics" columns from the "model summary" table. Sorry for teaching you the wrong stuff, I hope it wasn't too late for me to fix it. Please let me know if you need further clarification and elaboration.
I will post the answers for those unanswered questions on the blog once I get a response from Dr. Kim.
Thanks!
Thanks for coming to the review session tonight. I was just going through the notes and I realized that I made a mistake...
When we were talking about which F ratio and df you are reporting for each step of a hierarchical multiple regression, I told you to report the statistics from ANOVA table. Whoops, I was wrong. You should be reporting statistics under the "change statistics" columns from the "model summary" table. Sorry for teaching you the wrong stuff, I hope it wasn't too late for me to fix it. Please let me know if you need further clarification and elaboration.
I will post the answers for those unanswered questions on the blog once I get a response from Dr. Kim.
Thanks!
Question we asked in class re: the homework
So I asked a question in class and Dr. Kim asked that I would post the question and his response on the blog.
My question was, how do I interpret the data output? How can I tell if there was a significant change in R2?
Basically his response was that if the p value is significant(meaning it is small) you can say that there was a significant change in R2. if the model does not increase R2 by much and the p value is not significant (meaning it is too large), then simply state that the model when such and such variable was added did not significantly explain additional variance- or something to that effect
Hope it was helpful!
My question was, how do I interpret the data output? How can I tell if there was a significant change in R2?
Basically his response was that if the p value is significant(meaning it is small) you can say that there was a significant change in R2. if the model does not increase R2 by much and the p value is not significant (meaning it is too large), then simply state that the model when such and such variable was added did not significantly explain additional variance- or something to that effect
Hope it was helpful!
Need clarification for using SPSS (HW3)
Do I have to insert corresponding predicting IV's from each hypotheses to each block in one process? (e.g IV from hypotheses 1 -> block 1; IV from hypotheses 2-> block 2, IV from hypotheses 3-> block 3; run statistics)
Or do I run three different process for each predicting hypotheses then insert IV that needs to be provided into the following block?
(e.g. predicting IV from hypotheses 1 -> block 1; IV needed-> block 2; run statistics
predicting IV from hypotheses 2 -> block 1; IV needed -> block 2; run statistics
predicting IV from hypotheses 3 -> block 1; IV needed-> block 2; run statistics)
Or do I run three different process for each predicting hypotheses then insert IV that needs to be provided into the following block?
(e.g. predicting IV from hypotheses 1 -> block 1; IV needed-> block 2; run statistics
predicting IV from hypotheses 2 -> block 1; IV needed -> block 2; run statistics
predicting IV from hypotheses 3 -> block 1; IV needed-> block 2; run statistics)
Monday, November 9, 2009
Homework #2 & Quiz #2
I would like to let you know you can pick up your copies at the front desk.
Seong-Hyeon (Sung) Kim
Seong-Hyeon (Sung) Kim
Thursday, November 5, 2009
TA's -
Can we use a few quotes in our article reviews when discussing hypotheses, participants, or results?
I'm finding it really hard to paraphrase some of these sections.
I'm finding it really hard to paraphrase some of these sections.
Homework # 3
Hi TAs,
I'm looking at my schedule and see that Hmwk #3 is due on Monday (11/9). I think I missed it being passed out - is it available for pick up somewhere? Thank you!
I'm looking at my schedule and see that Hmwk #3 is due on Monday (11/9). I think I missed it being passed out - is it available for pick up somewhere? Thank you!
Articles not listed in the faculty recommended readings
Please attache a hard copy of the article you are reviewing if that is not included in the Faculty Recommended Readings when you submit your article reviews. So, if you are reviewing an article that is included in the Faculty Recommended Readings, you don't need to attach a hard copy, but only submit your review.
Best of luck to you!
Best of luck to you!
Wednesday, November 4, 2009
CI value
I was wondering where we get the "t(N-2)(1-alpha) value for the CI? On our slides, the example gives 1.97 for this value...so are we to use this every time we need a 95% CI...what is the value then if we want a 99% CI?
Thanks guys!
Thanks guys!
DOI
2 of my articles do not have a DOI. What exactly do I do then? Do i just cite it as if i read it directly in the journal? or do I have to provide a link to the article? in which case it would look like this at the end of my reference (based on the link supplied by ebscohost):
Retrieved from http://search.ebscohost.com.naomi.fuller.edu:2048/login.aspx?direct=true&db=psyh&AN=2004-16129-004&loginpage=Login.asp&site=ehost-live
that feels like it is too much information, but it links you to the article if you are logged in i believe
christie
t test meaning
What does t test mean in words? I understand that t test is used when we do not know the sigma of the population. I understand that it doesn't tell us about the variations. But what does it tell us if our output says t= 4 and is significant? what does that mean about our data set (using a sentence)?
do you understand what i am asking?
Thanks
Christie
Policy on tutoring
This is the policy on 1 on 1 tutoring with our TAs. You could meet with a TA no more than once for one hour or less for 1 on 1 tutoring. Anything beyond that would really be inappropriate in the context of the other demands placed on TA time.
You are also encouraged to make a good use of study groups, discussions in class and me.
You are also encouraged to make a good use of study groups, discussions in class and me.
Tuesday, November 3, 2009
clarification on article reviews
1) The example article shows that the word "from" in the fourth heading is not capitalized. Is this a typo? (i.e. should it be capitalized?) Dr. Kim seemed to think "from" was not capitalized in class. Just wanted to get everyone on the same page.
2) Is there supposed to be a period after the DOI number? The examples in the APA book don't seem to have it, but it wasn't explicit so I wanted to make sure.
Thanks!
2) Is there supposed to be a period after the DOI number? The examples in the APA book don't seem to have it, but it wasn't explicit so I wanted to make sure.
Thanks!
DOI for article reviews
So, in class we were told if a doi number wasn't available, we were to cite the website we retrieved the article from. However, the 6th ed. APA manual says on page 192 after the third bullet point additional info. about using EBSCO, which is where I will probably get my articles. I'm confused as to what this all means. How do I cite the URL properly from an EBSCO or PsycINFO article??? On page 191, 4th bullet point it states to provide the home page URL of the journal, book or report publisher...I'm computer illiterate...what exactly would be the home page in the library's EBSCO, etc??
Monday, November 2, 2009
Thursday, October 29, 2009
Thank you!
My apologies for intruding on your class blog, but it was the best way I could think of to contact you without adding to your email spam filter!
I just wanted to say thank you for the bagels the first year class provided for faculty and staff earlier this week. I also wanted to thank you for your attendance and participation at the community meeting. Both the bagels and the engagement were tremendously appreciated.
mlc
Department Chair...and your next quarter stats instructor :)
I just wanted to say thank you for the bagels the first year class provided for faculty and staff earlier this week. I also wanted to thank you for your attendance and participation at the community meeting. Both the bagels and the engagement were tremendously appreciated.
mlc
Department Chair...and your next quarter stats instructor :)
Wednesday, October 28, 2009
Table HELP!
If the correlation between two different values is 1.0, (ie. height in inches and height in feet), do we actually put a 1.00 into the table, or put the dash?
Please read wed night!
Sorry, but after I took the bold off of the top line as you said, the line isn't connected...it's the little dash marks w/that tiny space in between. Also, I cannot get the extra line after the title to go away. I clicked double space and tried to erase the extra line with no luck.
thanks!
Nikki
thanks!
Nikki
Tuesday, October 27, 2009
Confidence Interval (CI)
Someone from the class asked about confidence interval...
In order to understand confidence interval, you have to understand standard error first. When you run a simple/linear regression test on SPSS, one of the output table should contains standard error for your regression model. You will also see that the standard error falls under "unstandardized coefficients", which means that it is an unstandardized value.
Standard error (SE) is pretty much a self-explanatory term... obvious, it has something to do with error. Do you still remember the error that we are talking about in research model? So, whenever you have to infer your test analyzes results to the population, you need to count in the error because you're using sample in your research study rather than the whole population. SE is what you want to add or subtract from the predicted score (y variable). As regression is trying to find out whether the x variable predicts the y variable or not, you can try to guess what score you will get for the y variable by providing a score for the x variable. When you want to predict the y variable to the population, you have to add or subtract the SE from the predicted score to a range of score for the possible score of y in the population.
Let's get back to CI, APA publication manual strongly recommends us to report the 95% CI for any inferential statistics. When you say 95%CI, that means you are sure that 95% of the time you predicted score for the y variable falls within the CI. For example, let's say your SE is 1.50, and the predicted y value is 100. For 95%CI, you're sure that 95 out of 100 guesses you will get a score between 98.50 (100-1.50) and 101.5 (100+1.50) for your y variale in the population.
I hope the explanation of CI help you get through the homework.
In order to understand confidence interval, you have to understand standard error first. When you run a simple/linear regression test on SPSS, one of the output table should contains standard error for your regression model. You will also see that the standard error falls under "unstandardized coefficients", which means that it is an unstandardized value.
Standard error (SE) is pretty much a self-explanatory term... obvious, it has something to do with error. Do you still remember the error that we are talking about in research model? So, whenever you have to infer your test analyzes results to the population, you need to count in the error because you're using sample in your research study rather than the whole population. SE is what you want to add or subtract from the predicted score (y variable). As regression is trying to find out whether the x variable predicts the y variable or not, you can try to guess what score you will get for the y variable by providing a score for the x variable. When you want to predict the y variable to the population, you have to add or subtract the SE from the predicted score to a range of score for the possible score of y in the population.
Let's get back to CI, APA publication manual strongly recommends us to report the 95% CI for any inferential statistics. When you say 95%CI, that means you are sure that 95% of the time you predicted score for the y variable falls within the CI. For example, let's say your SE is 1.50, and the predicted y value is 100. For 95%CI, you're sure that 95 out of 100 guesses you will get a score between 98.50 (100-1.50) and 101.5 (100+1.50) for your y variale in the population.
I hope the explanation of CI help you get through the homework.
Good Plagiarism Q
This was in a comment, and I want to bring it out to the main blog because i have a feeling people aren't checking the comment sections. Christie asked:
"I am scared to plagarize. there is only so many ways you can say variable 1 and variable 2 are correlated. i dont want to get in trouble for saying something clearly, which happens to be the same way someone else did too. . . tips?"
You just now did a paraphrase Christie! I didn't write anything about correlation on mine. But, if you want more examples, that will come with reading articles. The more you read, the more you'll get the gist of your own style, because you'll have a deeper concept. That's probably the best thing i can tell you. actually, i asked the same thing last year...it's posted a ways down the blog, and Mari gave us good advice::
"I would strongly recommend that you read all the examples ...Read them carefully, understand how they are written, and then put them aside. Write your own write up, and do not consult the examples while you are writing. If necessary, refer back to the examples after you are finished writing to check and see that you included all important information. Don't actually look at the examples while you are writing, though, because that makes not plagiarizing very, very difficult."
Hope that helps!
"I am scared to plagarize. there is only so many ways you can say variable 1 and variable 2 are correlated. i dont want to get in trouble for saying something clearly, which happens to be the same way someone else did too. . . tips?"
You just now did a paraphrase Christie! I didn't write anything about correlation on mine. But, if you want more examples, that will come with reading articles. The more you read, the more you'll get the gist of your own style, because you'll have a deeper concept. That's probably the best thing i can tell you. actually, i asked the same thing last year...it's posted a ways down the blog, and Mari gave us good advice::
"I would strongly recommend that you read all the examples ...Read them carefully, understand how they are written, and then put them aside. Write your own write up, and do not consult the examples while you are writing. If necessary, refer back to the examples after you are finished writing to check and see that you included all important information. Don't actually look at the examples while you are writing, though, because that makes not plagiarizing very, very difficult."
Hope that helps!
APA Write ups! (Renewed)
Hello All. So, we finally have some clarification about what to include in the write-up and where!
A sample write up (although one I am presently making up as I go) will look as follows:
A linear regression was used to test the hypothesis that time in minutes would predict understanding. The overall model proved significant in that R = .97, F(1, 222) = 579.32, p < .001. As time in minutes increased, understanding also increased (B = 125.23, SEB = 0.25, β = .97, p < .001, 95% CI [123.23, 127.23]).
Until we find otherwise, we are going to report the CI with the coefficients that it relates to (the Betas) and NOT with the R statistics (like in the example given from page 117 of the APA manual), mainly because that is where SPSS is pulling the CI from, so that is how we would report it. PLEASE NOTE! You still need to report the proper statistics from the coefficient table, the 6th edition DID NOT take those away!!! Also...this is not the only way you can write a write up, make sure you are not plagiarizing the examples that any of us have given you! Mainly, just make sure that you include all the necessary elements of the write up and from there the style will come!
Hope this helps! Thanks for your patience as we figured this out!
A sample write up (although one I am presently making up as I go) will look as follows:
A linear regression was used to test the hypothesis that time in minutes would predict understanding. The overall model proved significant in that R = .97, F(1, 222) = 579.32, p < .001. As time in minutes increased, understanding also increased (B = 125.23, SEB = 0.25, β = .97, p < .001, 95% CI [123.23, 127.23]).
Until we find otherwise, we are going to report the CI with the coefficients that it relates to (the Betas) and NOT with the R statistics (like in the example given from page 117 of the APA manual), mainly because that is where SPSS is pulling the CI from, so that is how we would report it. PLEASE NOTE! You still need to report the proper statistics from the coefficient table, the 6th edition DID NOT take those away!!! Also...this is not the only way you can write a write up, make sure you are not plagiarizing the examples that any of us have given you! Mainly, just make sure that you include all the necessary elements of the write up and from there the style will come!
Hope this helps! Thanks for your patience as we figured this out!
Saturday, October 24, 2009
Answers for unanswered question from Monday Review Session last week
During the Monday Review Session last week, several questions were unanswered, but here are the answers.
1. What does F ratio tell you? What does it have to do with regression?
- F ratio tells you how big the explained variance and unexplained variance
- F ratio determines whether your regression model (in the case of regression) is significantly different from the null model (zero) or not
- the significance level tells you whether your regression model is significantly different from zero or not
2. What does d.f.s. mean in lecture 6 powperpoint slide 27?
- d.f.s = degress of freedoms
- referring to slide 26 ANOVA table (SPSS output), df for "total" is equal to the sum of df for "regression" and df for "residual"
3. Do I have to know assumptions of regression now (see lecture 6 powerpoint slide 18)?
- no, don't worry about it if you don't understand it now. Sung will revisit this topic with a lecture later on in the course.
1. What does F ratio tell you? What does it have to do with regression?
- F ratio tells you how big the explained variance and unexplained variance
- F ratio determines whether your regression model (in the case of regression) is significantly different from the null model (zero) or not
- the significance level tells you whether your regression model is significantly different from zero or not
2. What does d.f.s. mean in lecture 6 powperpoint slide 27?
- d.f.s = degress of freedoms
- referring to slide 26 ANOVA table (SPSS output), df for "total" is equal to the sum of df for "regression" and df for "residual"
3. Do I have to know assumptions of regression now (see lecture 6 powerpoint slide 18)?
- no, don't worry about it if you don't understand it now. Sung will revisit this topic with a lecture later on in the course.
Homework 2 help
Some people from your class asked about how to report statistical results in APA style, here is a sample that you can follow, but you need to paraphrase it in order to use it in your homework.
To report your model is significant or not (for all kinds of regression):
Significant relationship between number of cars and air pollution index was found, that the number of cars can predict air pollution index, R2 = .88, F(1, 33) = 236.32, p < .001, 95% CI [.02, .22].
To report the direction of your model (for simple regression only):
Increasing the number of cars was related to more severe air pollution, B = 3.87, SEB = 0.25, β = .94, p < .001.
As always, it is worthwhile to look up APA Publication Manual (6th ed.) because it provides critical information on how to do a write-up correctly for your homework. :)
Good luck! ;-)
To report your model is significant or not (for all kinds of regression):
Significant relationship between number of cars and air pollution index was found, that the number of cars can predict air pollution index, R2 = .88, F(1, 33) = 236.32, p < .001, 95% CI [.02, .22].
To report the direction of your model (for simple regression only):
Increasing the number of cars was related to more severe air pollution, B = 3.87, SEB = 0.25, β = .94, p < .001.
As always, it is worthwhile to look up APA Publication Manual (6th ed.) because it provides critical information on how to do a write-up correctly for your homework. :)
Good luck! ;-)
Friday, October 23, 2009
Need clarification on the assignment
Do we also need to plot the linear regression line and show the equation for it?
Thursday, October 22, 2009
Monday Review Session Location
Some people suggested to meet in the computer lab for Monday review session; however, we will be meeting at the same old location, Payton 100 (right by the Garth) at 5:30pm. Thanks.
Wednesday, October 21, 2009
A word on early Article Reviews
Here's the deal. You can turn in your article review early like Dr. Kim said. We your TA's will look over ONE and return it to you with marks but NO GRADE WILL BE ENTERED. All required article reviews will still need to be turned in by the normal dead line. This means if you have an early review returned to you, YOU MUST TURN IT IN AGAIN to receive credit. Also, if you have turned in more than one article for early review only one will be reviewed but both will be returned to you so you can make corrections on both. If you have turned in two different types of articles we will still only "test grade" one. Sorry if this disappoints, we have to draw a line somewhere =). Most of the issues that people will have relate to formatting and are more or less the same for both types of reviews.
Thanks!
Your TA's
Thanks!
Your TA's
Tuesday, October 20, 2009
Single space is recommended.
Yes, I know. Double space is the standard. However, we want to save trees. Thanks.
You can submit your very first article review for a check and get it back with no grade or no penalty, if you want to. However, you need to submit it soon because TAs will be inundated with many article reviews as the first deadline (first 4 article reviews by either Nov. 2nd or 3rd) is approaching. Please note that TAs will be reading about 150 article reviews in early November.
You can submit your very first article review for a check and get it back with no grade or no penalty, if you want to. However, you need to submit it soon because TAs will be inundated with many article reviews as the first deadline (first 4 article reviews by either Nov. 2nd or 3rd) is approaching. Please note that TAs will be reading about 150 article reviews in early November.
article review questions..again.
I know that the new edition of the APA manual says we have to double space everything. Is that true for our reference list? Do we double space after each period?
Monday, October 19, 2009
Another Article Review Question
I was asked:
"do we have to include a copy of the article with our review? And, how do you tell the difference between an empirical article and the other one"
(a) No, you do not have to include a copy of the article. If we need something, that's what the reference is also used for, you're most likely getting it on EBSCO, so if we need it we will be able to search for it on EBSCO.
(b) My fellow TAs and/or Sung can add to this second part if they think of better clarifications. I think that The best way is to see whether or not there were any tests run. If you see numbers, it is most likely empirical. If you see any statistics, this is most likely empirical. Theory-based articles will just base off of theory, and so when you read through it and write the review you'll use those other headings found on the second page of the example to clarify (i.e., Reference, Major Premise, Development of the Argument, Population From Which the Theory was Developed, Strengths and Limitations of the Paper, Relevance for the Current Question)
Hope this helps...other TAs and Sung may help more.
"do we have to include a copy of the article with our review? And, how do you tell the difference between an empirical article and the other one"
(a) No, you do not have to include a copy of the article. If we need something, that's what the reference is also used for, you're most likely getting it on EBSCO, so if we need it we will be able to search for it on EBSCO.
(b) My fellow TAs and/or Sung can add to this second part if they think of better clarifications. I think that The best way is to see whether or not there were any tests run. If you see numbers, it is most likely empirical. If you see any statistics, this is most likely empirical. Theory-based articles will just base off of theory, and so when you read through it and write the review you'll use those other headings found on the second page of the example to clarify (i.e., Reference, Major Premise, Development of the Argument, Population From Which the Theory was Developed, Strengths and Limitations of the Paper, Relevance for the Current Question)
Hope this helps...other TAs and Sung may help more.
Subscribe to:
Posts (Atom)